
Overview
Insurelytics is a desktop client management application for insurance agents. Insurelytics facilitates the tracking of client and policies, and also generate statistical analytics to provide insights for the agent. The user interacts with it using a CLI, and it has a GUI created with JavaFX. It is written in Java, and has about 85 kLoC.
Summary of contributions
-
Major enhancement: Added the
displayfeature.-
What it does: Displays indicators of the address book in specified format. The agent can visualise the age group breakdown, policy popularity breakdown, and gender breakdown of his address book. Visualisation comes in the form of bar chart, pie chart, or line chart.
-
Justification: Analytics of the data in the address book yield insight for the agent. This facilitates data-driven decisions by the agent.
-
Highlights:
-
The
displaymechanism follows the Model-View-Controller design pattern. It also uses an OOP solution, which features the use of abstract classes to reuse code. The OOP solution is illustrated in the developer’s guide. -
displayalso required mastery of JavaFX.
-
-
-
Code contributed: [tP Code Dashboard]
-
Functional Code contributed:
-
Model: [Model Manager]
-
getPolicyPopularityBreakdown(),getAgeGroupBreakdown(),getGenderBreakdown()
-
-
View: [Bar Chart View][Pie Chart View][Line Chart View]
-
Controller: [Display Controller][Axis Controller][Piechart Controller][Linechart Controller]
-
Command: [Display Command][Display Command Parser]
-
-
Test Code Contributed: [Display Command Test][Display Command Parser Test][Model Manager Test]
-
Minor enhancement:
-
Save policies into JSON. Policy data needs to persist across usage of application. [Pull request #81]
-
List Policy Command. [Pull Request #86]
-
Updated tests to include policies. [Pull Request #91]
-
Utility to handle DateOfBirth (such as
parseAgeGroup) [Functional Code][Test Code]
-
-
Other contributions:
-
Tools:
-
Set up


and Bug Report Template
-
IntelliJ to auto format based on
checkstyle.xml.
-
-
Project Management:
-
Managed releases from v1.1 to v1.3 on GitHub
-
-
Documentation:
-
Resolved part of the documentation bugs from PE dry run (Pull request #187)
-
-
Contributions to the User Guide
Given below are sections I contributed to the User Guide. They showcase my ability to write documentation targeting end-users. |
Display Indicator: display
Displays indicator according to specified format.
Format:
display i/INDICATOR f/FORMAT
| Every format supports every indicator |
Examples:
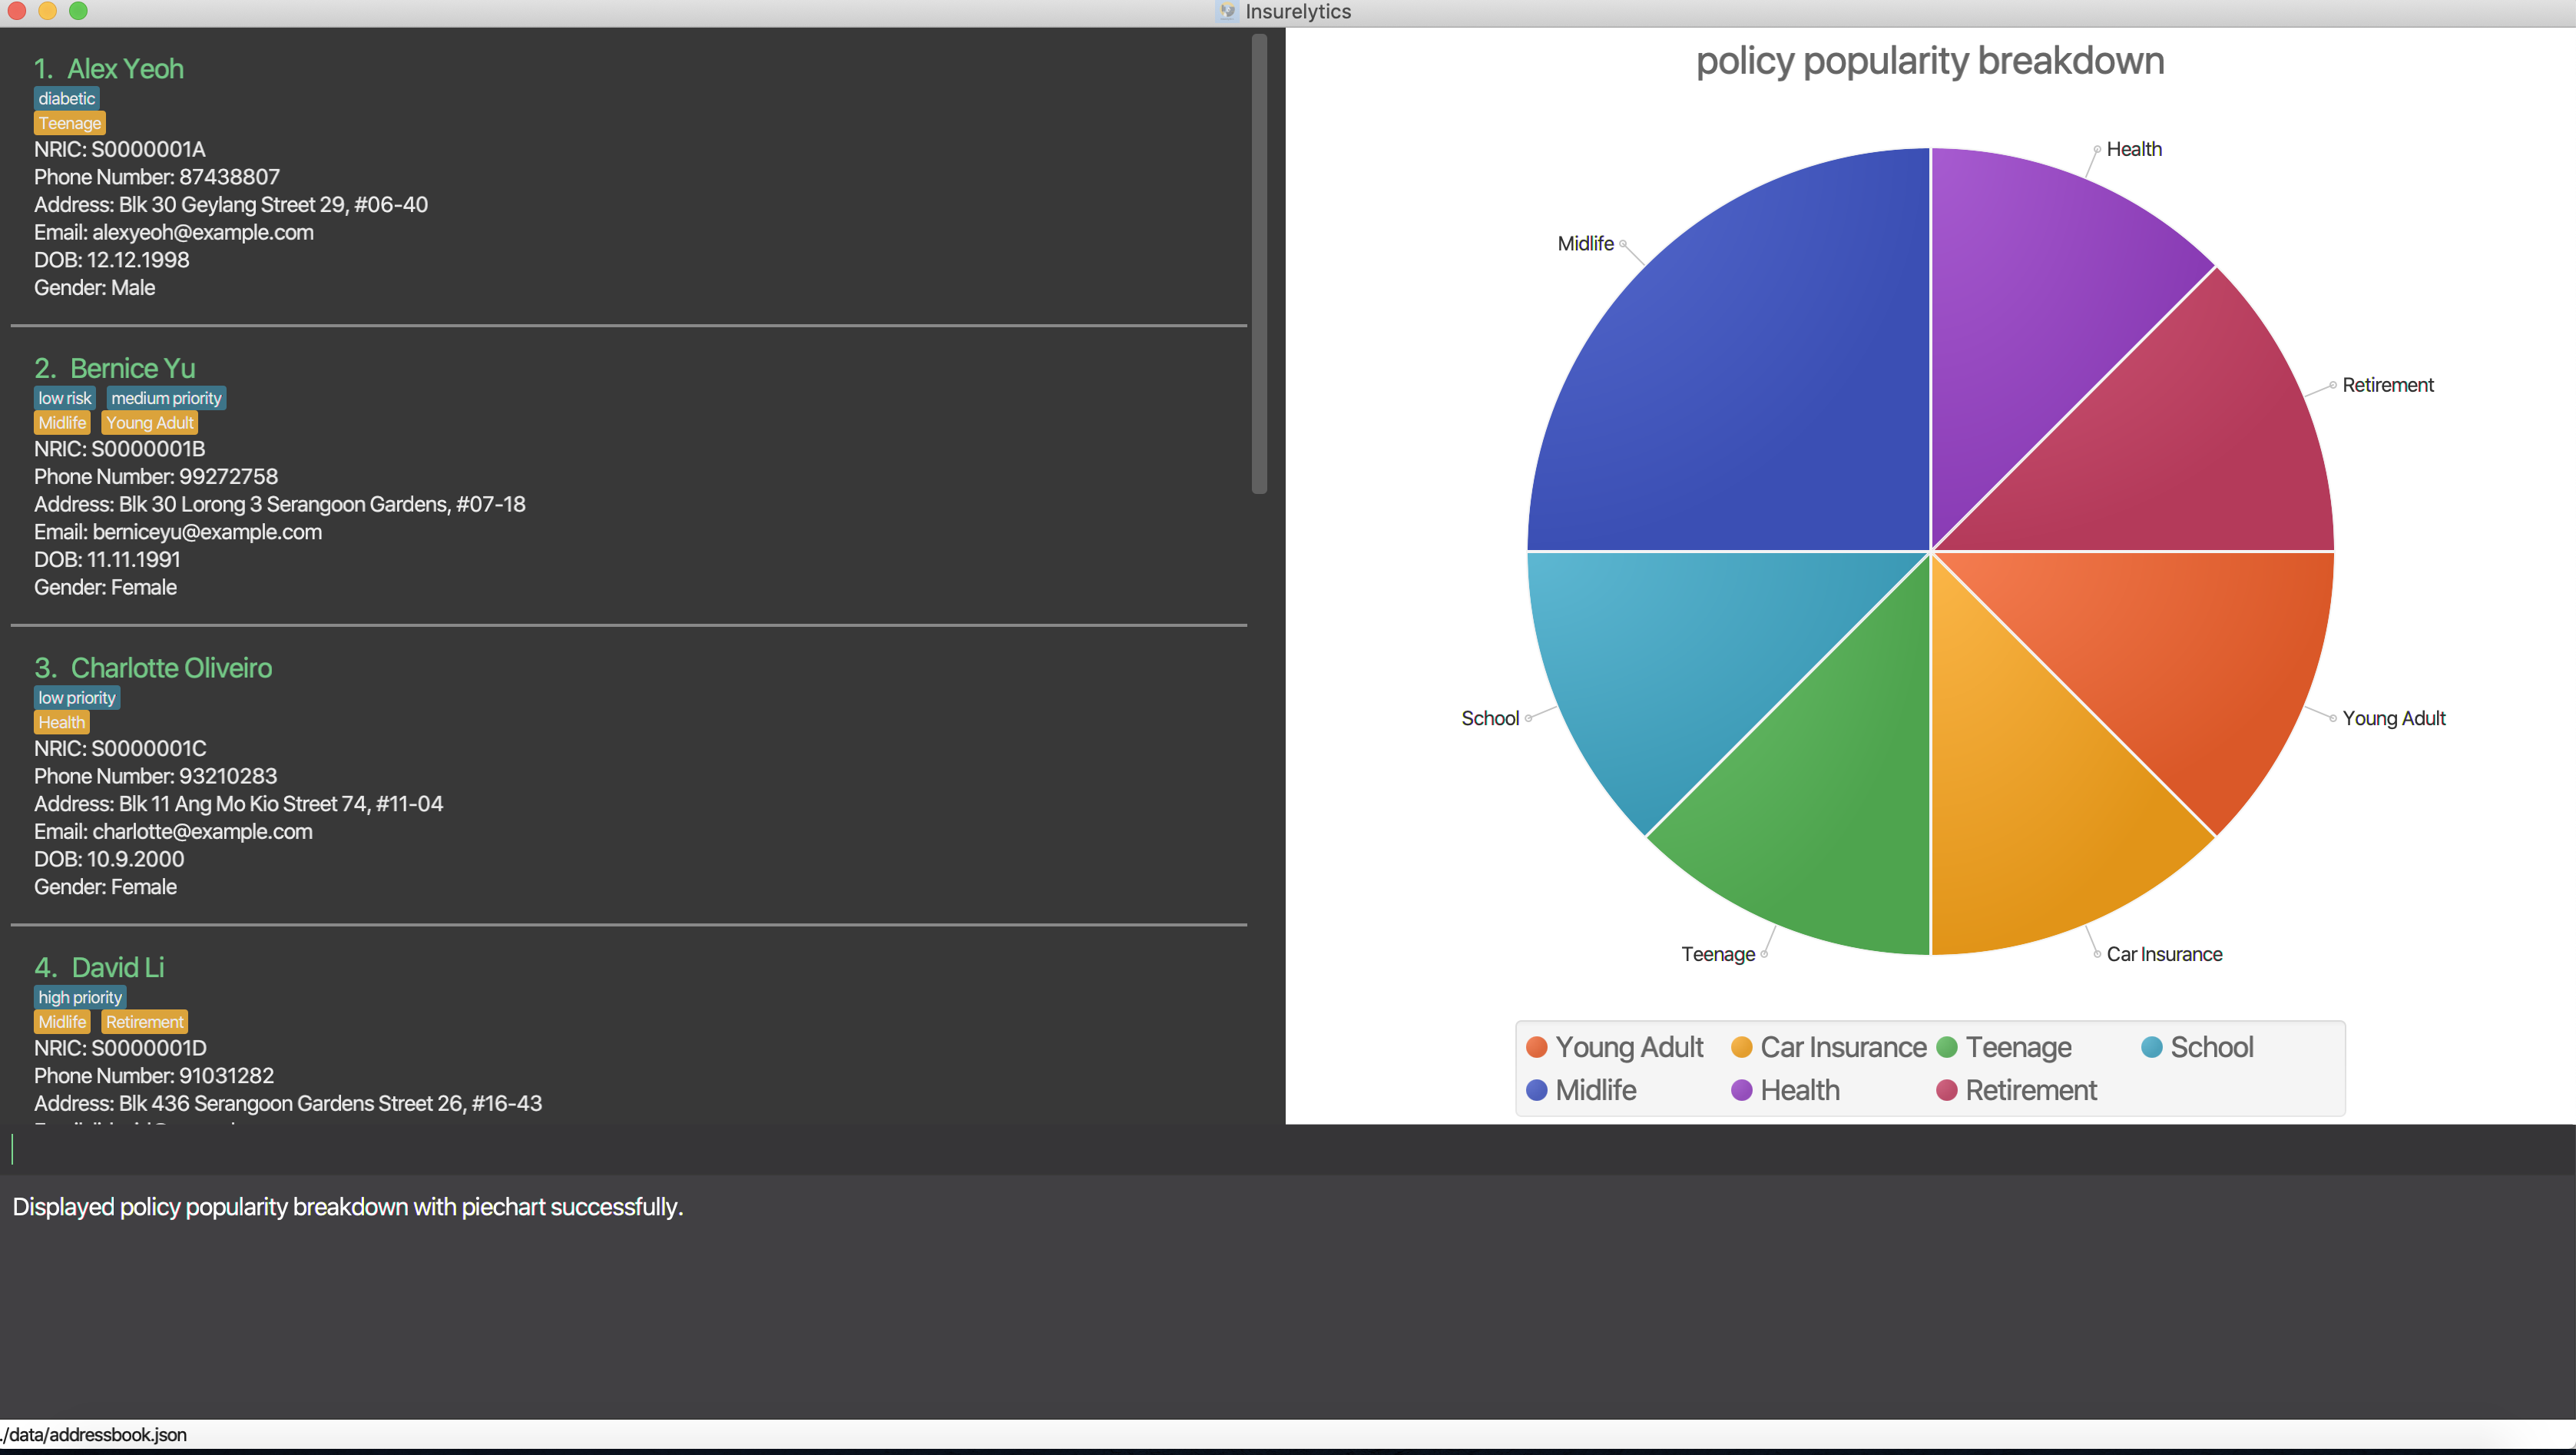
display i/policy-popularity-breakdown f/piechart
Displays policy popularity breakdown as a piechart.
Expected Output:
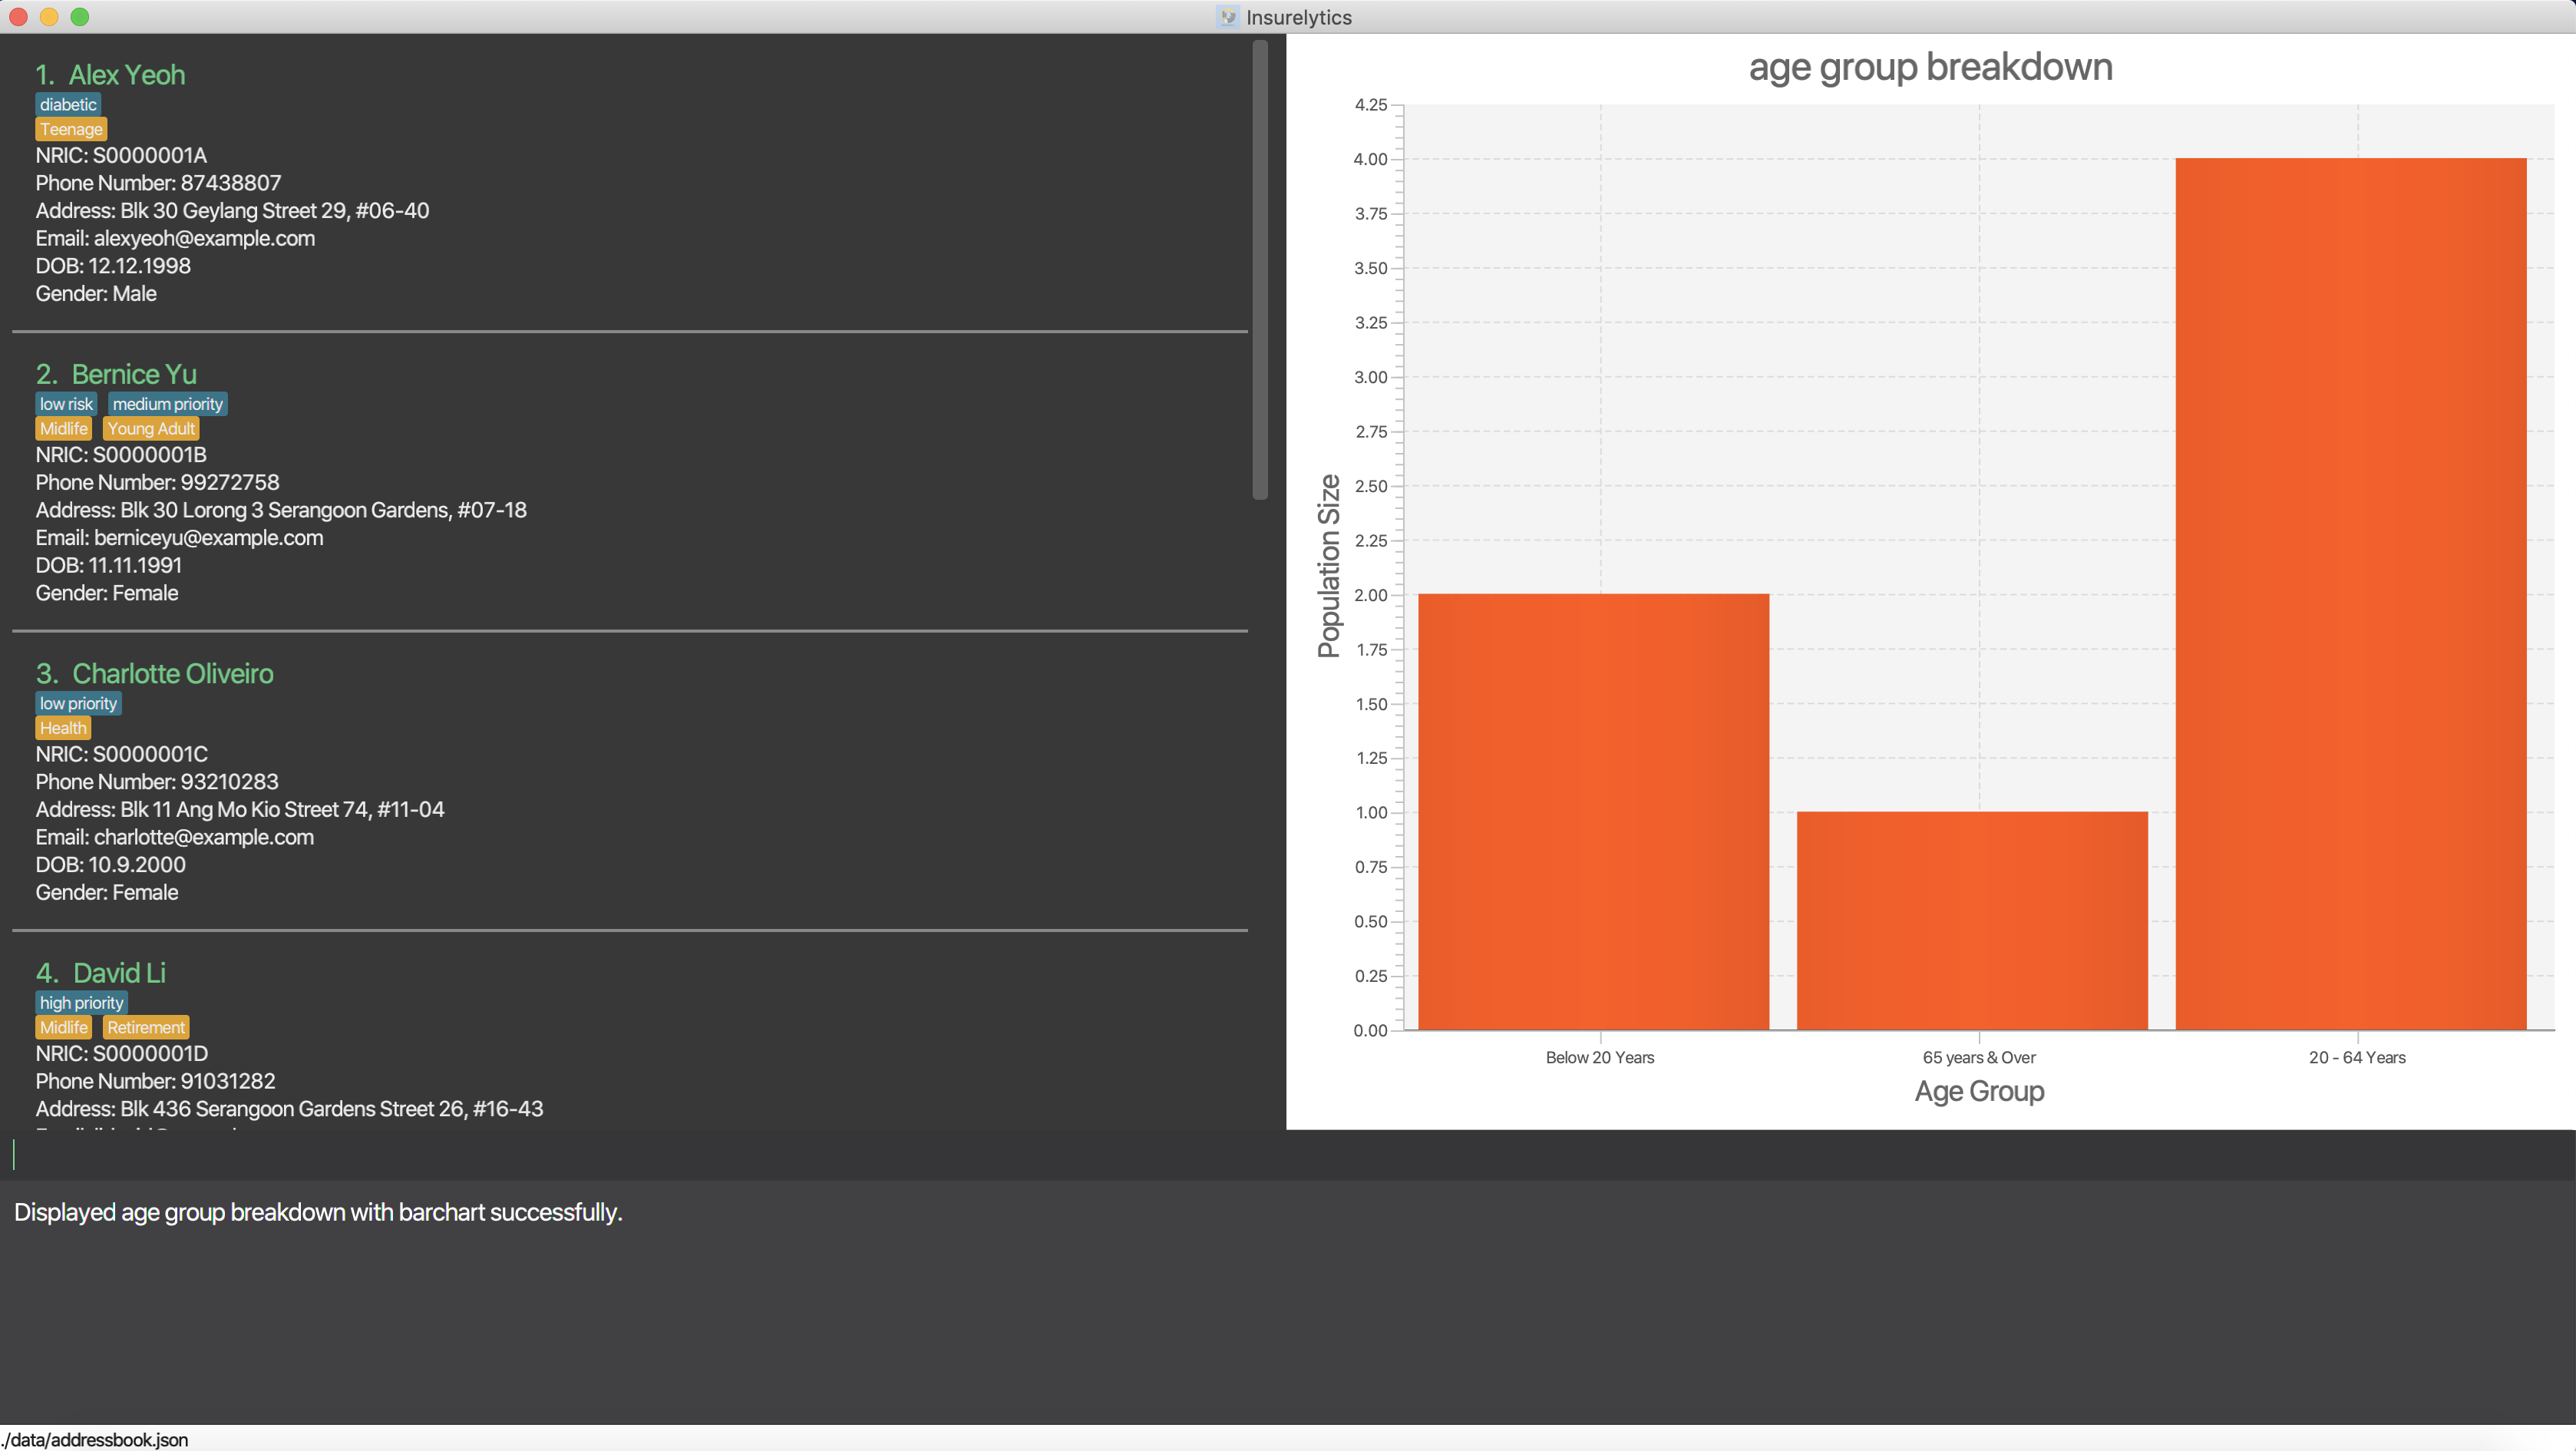
display i/age-group-breakdown f/barchart
Displays age group breakdown as a barchart.
Expected Output:
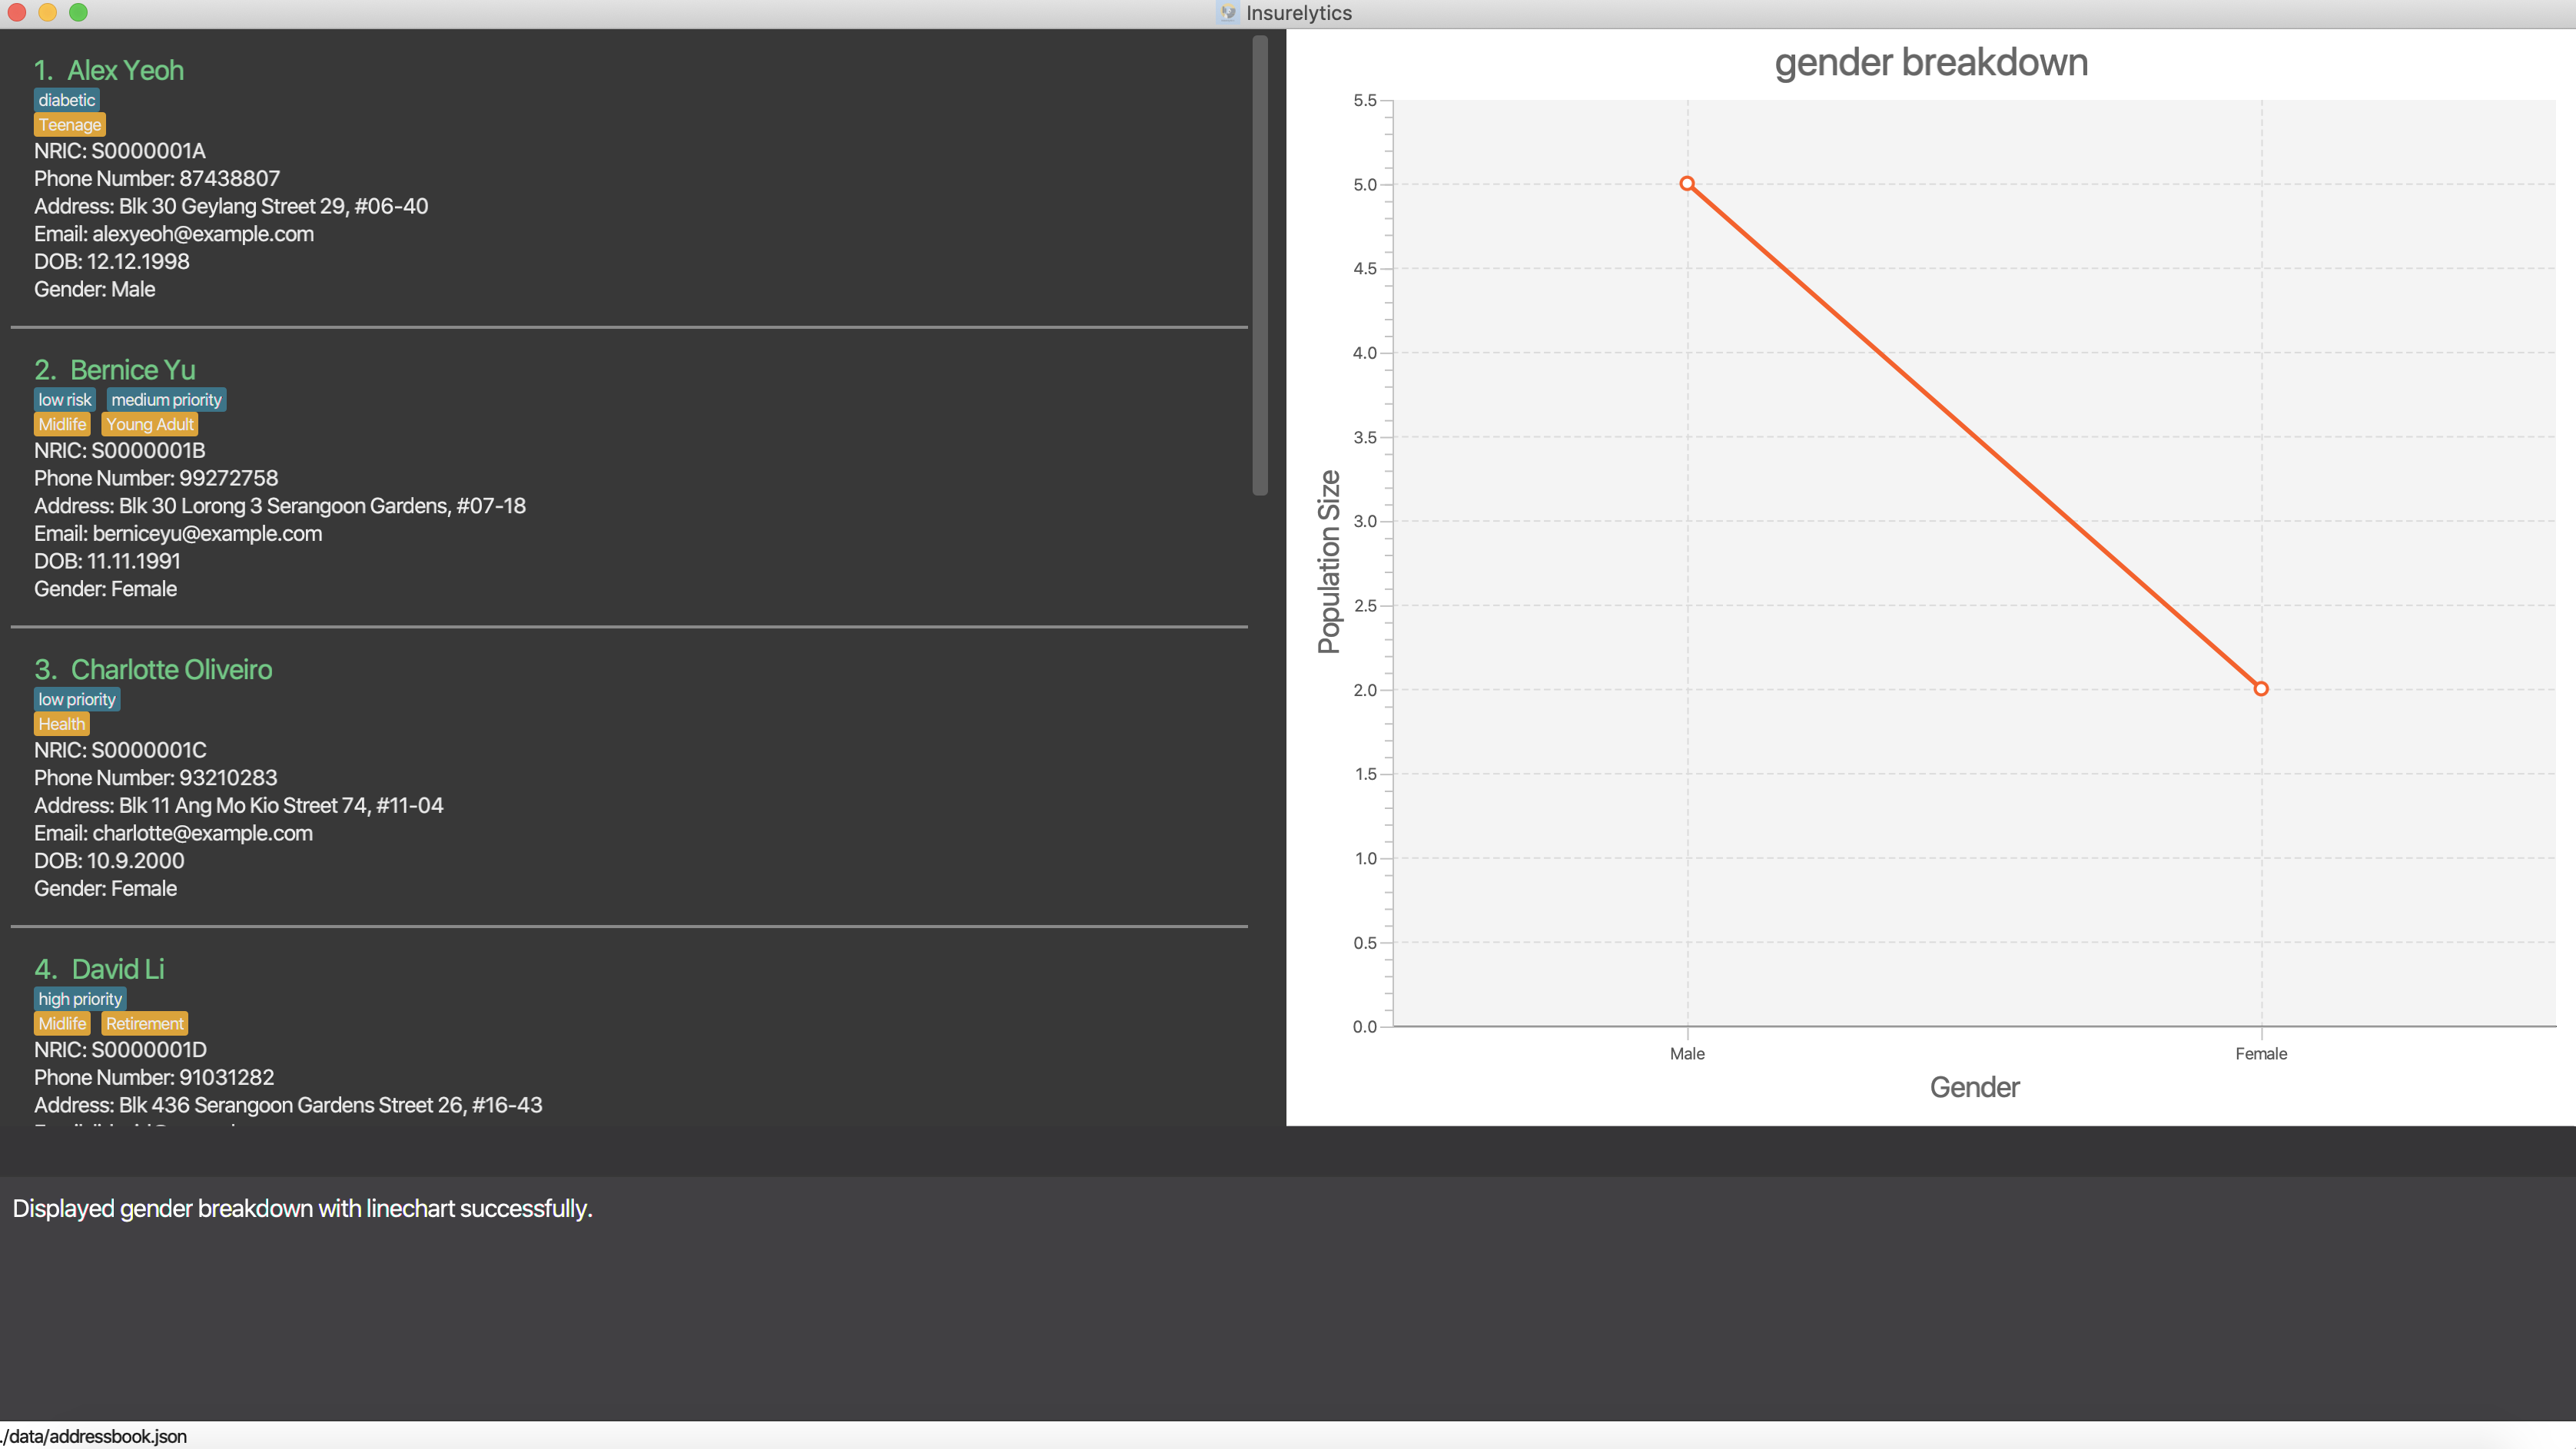
display i/gender-breakdown f/linechart
Displays gender breakdown as a linechart.
Expected Output:
Adding a person: add
Adds a person to the list of people
Format: add n/NAME ic/NRIC p/PHONE_NUMBER e/EMAIL a/ADDRESS dob/DATE_OF_BIRTH g/GENDER
Examples:
-
add n/John Doe ic/S0000001J p/98765432 e/johnd@example.com a/311, Clementi Ave 2, #02-25 dob/12.12.1912 g/Male
Expected Output:
New person added: John Doe NRIC: S0000001J Phone: 98765432 Email: johnd@example.com Address: 311, Clementi Ave 2, #02-25 Date of birth: 12 December 1912 Gender: MaleAdding a policy: addpolicy
Adds a policy to the list of policies
Format: addpolicy n/NAME d/DESCRIPTION c/[days/DAYS_VALID][months/MONTHS_VALID][years/YEARS_VALID] pr/PRICE [sa/START_AGE] [ea/END_AGE]
Examples:
-
addpolicy n/Senior Care d/Care for seniors c/days/20 months/11 years/5 pr/$50000 sa/50 ea/75
Expected Output:
New policy added: Senior care Description: Care for seniors Coverage: days/20 months/11 years/5 Price: $50000 Start Age: 50 End Age: 75Contributions to the Developer Guide
Given below are sections I contributed to the Developer Guide. They showcase my ability to write technical documentation and the technical depth of my contributions to the project. |
Display Feature
Implementation
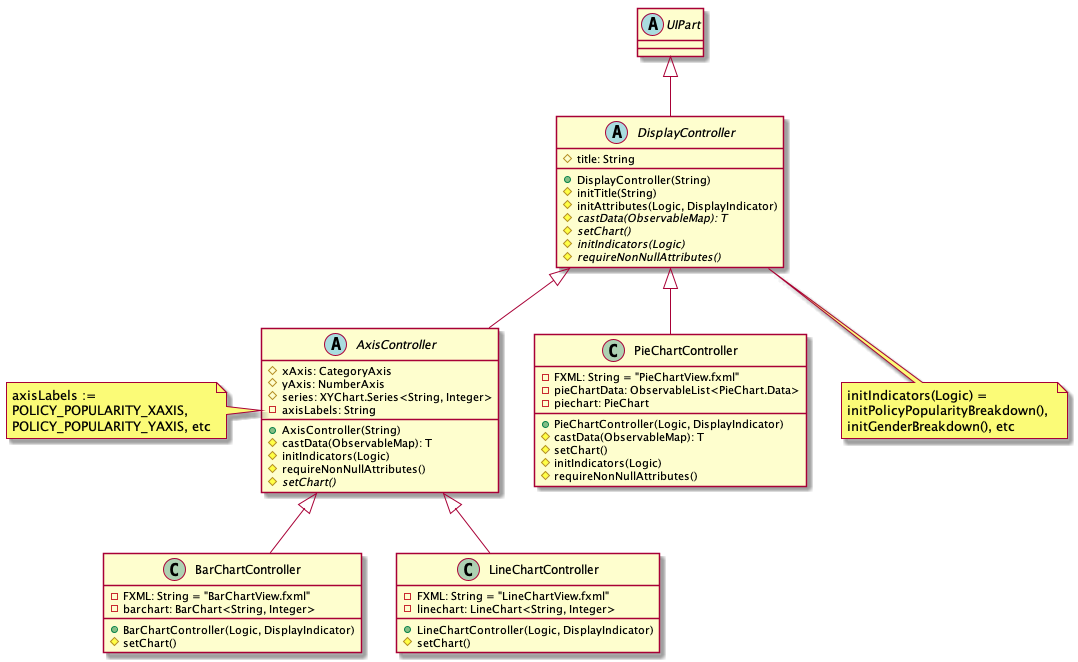
The display mechanism follows the Model-View-Controller design pattern. The model is facilitated by the AddressBook
instance, which provides the data the controller needs.
The controller is facilitated by an abstract class DisplayController, which extends UIPart<Region>.
Every supported format controller extends this abstract class.
The following class diagram shows the OOP solution for display:
Every controller needs to support every indicator. In the event a controller cannot display a particular
indicator, it will throw a parseException error, which provides suggestions of which visual controllers are supported
by the particular indicator.
|
The view is facilitated by the associated FXML. These views share a common CSS, and also have their individual CSS file.
Given below is an example usage scenario and how the display mechanism behaves at each step.
Step 1. The user executes the display i/policy-popularity-breakdown f/barchart command to display the policy
popularity breakdown indicator in bar chart format. The execution of a display command determines
what will be shown (displayIndicator) and how it will be shown (displayFormat).
Step 2. displayFormat specifies that the controller BarChartController will be instantiated.
Step 3. The BarChartController initialises all the attributes of its associated FXML in its construction.
Let us take a closer look at the initialisation of the series attribute. The controller utilises the display
indicator policy-popularity-breakdown to retrieve the data in the model it needs. The controller
then casts the model’s data type to the data type supported by bar charts. The result is assigned to series attribute.
The following sequence diagram shows the interaction between UI, Controller and Model for steps 2 and 3:
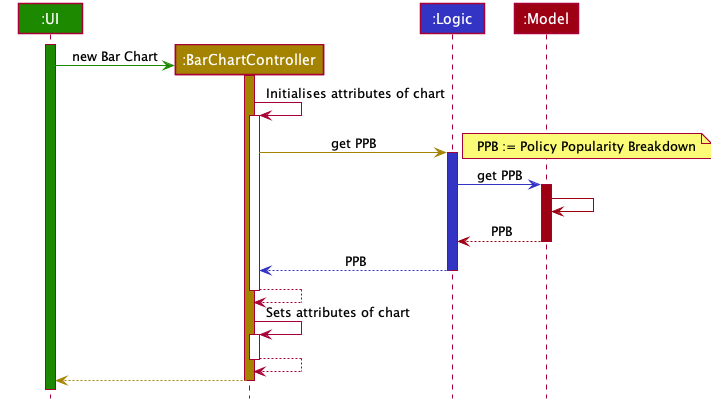
Step 4. The bar chart controller then sets all the attributes of its associated FXML.
Step 5. Finally, the MainWindow calls DisplayController#getRoot() and displays the view.
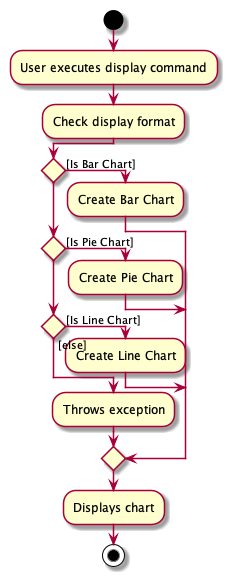
The following activity diagram summarizes what happens when a user executes the display command:
Design Considerations
Aspect: How should controllers interact with model
-
Alternative 1 (current choice): Within controllers (by passing
logic, which accesses the model, as an argument to the instantiation of a controller.)-
Pros: Every controller handles their own interaction with the model.
-
Cons: Inconsistent with current implementation (alternative 2).
-
-
Alternative 2: Within
MainWindow-
Pros: Consistent with current implementation
-
Cons: The controllers are fully dependent on
MainWindowfor the data from the model. This entails that
-
Aspect: OOP solution for visual controllers
-
Alternative 1 (current choice): Display controllers to extend from abstract class
DisplayController-
Pros:
-
Allows display controller subclasses to share code. (refer to class diagram above)
-
Subclasses have many common methods (
initIndicators(Logic))
-
-
-
Alternative 2: Display controllers to implement interface
DisplayController-
Pros: Satisfies the can-do relationship of an interface.
-
Cons: Restricted to public access modifiers. This violates Law of Demeter.
-
Use case: Add person
Guarantees:
-
Person is added even if input fields might be invalid (see 1a).
MSS
-
User requests to add a person.
-
Insurelytics adds the person.
Use case ends.
Extensions
-
1a. Either of the given NRIC, contact number, or email address is invalid.
-
1a1. Insurelytics adds the person into address book.
-
1a1. Insurelytics shows a warning.
-
-
1b. Duplicate profile is added.
-
1b1. Insurelytics shows an error message and will attempt to merge the profile.
-
Displaying indicators
-
Indicators are up to date and shown in the correct format
-
Test case:
display i/policy-popularity-breakdown f/piechart
addpolicy n/Child Care d/Care for children c/days/20 months/11 years/5 pr/$50000 sa/0 ea/10
Expected: Popularity of child care policy should be 0. Format of indicator should be piechart. -
Test case:
display i/age-group-breakdown f/linechart
add n/Norman ic/S0000001A p/98765432 e/johnd@example.com a/311, Clementi Ave 2, #02-25 dob/12.12.2000 g/Male
Expected: Number of people in the age group below 20 years old should increase by 1. Format of indicator should be linechart. -
Test case:
display i/gender-breakdown f/barchart
add n/Sally ic/S0000002A p/98765432 e/johnd@example.com a/311, Clementi Ave 2, #02-25 dob/12.12.2000 g/Female
Expected: Number of females should increase by 1. Format of indicator should be barchart.
-